
It all begins with an idea.

A&B Co. Case Study
Introduction
A&B Co Analytics Case Study. This case study focuses on A&B Co, eCommerce company in Brazil.
This project will follow the steps provided in the course:
• The steps in order are as follows: Ask, Prepare, Process, Analyze, Share, and Act
• At each step there will be a roadmap which will include:
o Guiding questions and their answers
o Key tasks
o Deliverable’s
Ask
Scenario
You’re a Data Scientist / Business Analyst working for a new eCommerce company called A&B Co. (similar to Amazon) and you’ve been asked to prepare a presentation for the Vice President of Sales and the Vice President of Operations that summarizes sales and operations thus far. The summary should include (at a minimum) a summary of current state the business, current customer satisfaction, and a proposal of 2-3 areas where the company can improve. Here are some facts:
It’s currently September 2018 (e.g., you can ignore all data after September 2018)
The company’s inception was January 2017 (so you can ignore all data before January 2017)
Company is US-based, but launched in Brazil (which is why some information is in Portuguese)
You can assume all orders are delivered (so ignore the order state field)
Characters and Stakeholders
Vice President of Sales and Vice President of Operations
Guiding Questions
What is the problem you are trying to solve?
The main objective is to determine what is the current state of the business, the current customer satisfaction and determine 2 to 3 areas in order to improve our business.
How can your insights drive business decisions
My insights can help drive business decisions by finding where the company is currently excelling and where there are areas of improvement and how to improve them.
Key Tasks
Identify the business task – completed
Consider key stakeholders - completed
Deliverable
A clear statement of the business task
-Determine the current state of the business and current customer satisfaction to improve operations
Prepare
Guiding Questions
Where is your data located?
The data was located off a Kaggle Dataset. The raw data can be found here: A&B Co csv Files
How is the data organized?
My data is organized into 7 different csv datasets. Each dataset pertaining to customer, order reviews, products, order payments, order items, product category names and order dataset.
Are there issues with bias or credibility in this data? Does your data ROCCC?
The data is first-party data collected by A&B Co, so there is little chance of bias, but because it is the company's data, the credibility is extremely high. The data also ROCCC because it is trustworthy, original, comprehensive, current, and cited.
How are you addressing licensing, privacy, security, and accessibility?
The data is open source and provided by the company; however, it is subject to their license (provided above).
How did you verify the data’s integrity?
The data was examined, and all of them are consistent in terms of the columns (amount and names), as well as the data types.
How does this help you answer your question?
The data allows us to examine product orders volumes, company revenue, and customer reviews to determine if the company’s current status and needs.
Are there any problems with the data?
There are some columns with null values than be removed. Also some additional information regarding product names, monthly columns, and review titles would add to the data’s value.
Key Tasks
1. Download data and store it appropriately – completed
2. Identify how it’s organized – completed
3. Sort and filter the data – completed
4. Determine the creditability of the data - completed
Deliverable
A description of all data sources used
· The data is source consists of 7 different csv files. Each file pertaining to customer, order reviews, products, order payments, order items, product category names and order dataset. The periods starts from September 2016 and runs until October 2018.
Process
Guiding Questions
What tools are you choosing and why?
I am using Excel for data cleaning and BigQuery (SQL) to allow for analysis and manipulation.
Have you ensured your data’s integrity?
I verified the datatypes were consistent after alteration by looking at the columns after any changes.
What steps have you taken to ensure that your data is clean?
The duplicates, NAs, and NULLS were removed.
Key tasks
1. Check the data for errors – completed
2. Choose your tools – completed
3. Transform the data so you can work with it effectively – completed
4. Document the cleaning process – completed
Deliverable
Documentation of any cleaning or manipulation of data
SQL
Let’s start by figuring out the company’s current state of business in revenue.
#Total Revenue from 2016-2018
SELECT SUM(payment_value)
FROM `case-study-1-372917.AB_Co_data.order_payments`
WHERE (payment_value) > 0;
=$16,008,872
Now let’s look at how much revenue was made in each individual year
#Revenue from 2016
select SUM(payment_value)
FROM `case-study-1-372917.AB_Co_data.order_payments` as p
INNER JOIN `case-study-1-372917.AB_Co_data.orders_dataset` as o
ON p.order_id = o.order_id
wHERE order_purchase_timestamp between "2016-09-04 21:15:19 UTC"
and "2017-1-5 11:56:06 UTC";
=$59,381.96
#Revenue from 2017
select SUM(payment_value)
FROM `case-study-1-372917.AB_Co_data.order_payments` as p
INNER JOIN `case-study-1-372917.AB_Co_data.orders_dataset` as o
ON p.order_id = o.order_id
wHERE order_purchase_timestamp between "2017-1-5 11:56:06 UTC"
and "2017-12-31 23:29:31 UTC";
=$7,249,746
#Revenue from 2018
select SUM(payment_value)
FROM `case-study-1-372917.AB_Co_data.order_payments` as p
INNER JOIN `case-study-1-372917.AB_Co_data.orders_dataset` as o
ON p.order_id = o.order_id
wHERE order_purchase_timestamp between "2018-1-1 02:48:41 UTC"
and "2018-10-17 17:30:18 UTC";
=$8,699,763
Now let’s look at the order volume of products sold
#Total Order Volume from 2016-2018
SELECT SUM(order_item_id)
FROM`case-study-1-372917.AB_Co_data.order_items`;
=134,936 orders
Now let’s look at the order volume for each individual year
#Total Order Volume in 2016
SELECT COUNT(order_purchase_timestamp)
FROM `case-study-1-372917.AB_Co_data.orders_dataset`
WHERE order_purchase_timestamp BETWEEN '2016-9-4 21:15:19 UTC' AND '2017-1-5 11:56:06 UTC'
=330 orders
#Total Order Volume in 2017
SELECT COUNT(order_purchase_timestamp)
FROM `case-study-1-372917.AB_Co_data.orders_dataset`
WHERE order_purchase_timestamp BETWEEN '2017-1-5 11:56:06 UTC' AND '2017-12-31 23:29:31 UTC'
=45,101 orders
#Total Order Volume in 2018
SELECT COUNT(order_purchase_timestamp)
FROM `case-study-1-372917.AB_Co_data.orders_dataset`
WHERE order_purchase_timestamp BETWEEN '2018-1-1 02:48:41 UTC' AND '2018-10-17 17:30:18 UTC'
=54,011 orders
Let’s transition to see a customer summary based on behavior and demographics
#Top 3 Highest Consuming Cities from 2016-2018
SELECT customer_city, COUNT(*) as count
FROM `case-study-1-372917.AB_Co_data.customers`
GROUP BY customer_city
ORDER BY count DESC
LIMIT 3;
=Top 3 Cities
1. Sao Paulo (15540)
2. Rio De Janeiro (6882)
3. Belo Horizonte (2773)
Next, let’s examine customer behavior. We can observe customer satisfaction based on customer reviews. Customers can review products on a scale from 1 to 5 stars.
#Most common review score on a scale of 1 to 5 stars.
SELECT review_score, COUNT(*) as count
FROM `case-study-1-372917.AB_Co_data.order_reviews`
GROUP BY review_score
ORDER BY count DESC
LIMIT 5;
=
1. 5 (57,420 Reviews)
2. 4 (19,200 Reviews)
3. 1 (11,858 Reviews)
4. 3 (8,287 Reviews)
5. 2 (3,235 Reviews)
Interesting, the third most common is the third review is a one star rating, lets investigate further.
Let’s look at the product categories belonging to the highest and lowest ratings and see if there is any pattern we can determine.
#Top 5 Most popular five star rated Product Categories
select product_category_name, count(r.review_score)
from `case-study-1-372917.AB_Co_data.products` as p
inner join `case-study-1-372917.AB_Co_data.order_items` as i
on p.product_id = i.product_id
inner join `case-study-1-372917.AB_Co_data.order_reviews` as r
on r.order_id = i.order_id
WHERE review_score = 5
group by product_category_name
order by count(r.review_score) desc
limit 5;
=
1. Health Beauty (Beleza_saude)
2. Bed Bath Table (cama_mesa_banho)
3. Sports Leisure (Esporte_lazer)
4. Computer Accessories (Informatica_acessorios)
5. Furniture Décor (Moveis_decoracao)
#Top 5 one star rated Product Categories
from `case-study-1-372917.AB_Co_data.products` as p
inner join `case-study-1-372917.AB_Co_data.order_items` as i
on p.product_id = i.product_id
inner join `case-study-1-372917.AB_Co_data.order_reviews` as r
on r.order_id = i.order_id
WHERE review_score = 1
group by product_category_name
order by count(r.review_score) desc
limit 5
=
1. Bed Bath Table (cama_mesa_banho)
2. Health Beauty (Beleza_saude)
3. Sports Leisure (Esporte_lazer)
4. Computer Accessories (Informatica_acessorios)
5. Furniture Décor (Moveis_decoracao)
What we know about the dataset:
o A&B Co has a total revenue of $16,008,872 between August 2016 to October 2018
o The most successful year based on order volume is 2018
o The top consuming city for orders was San Paulo
o The top 3 most common review scores from 1 to 5 are 5 stars, 4 stars, and 1 stars
o The most popular product category based off order volume is Furniture Décor
o The most popular product category based off customer rating satisfaction was Health and Beauty
o The least popular product category based off customer rating satisfaction was Bed Bath Table
Deliverable
Supporting visualizations and key findings
Tableau Visualizations
Full Dashboard can be found at this link: A&B Co Dashboard
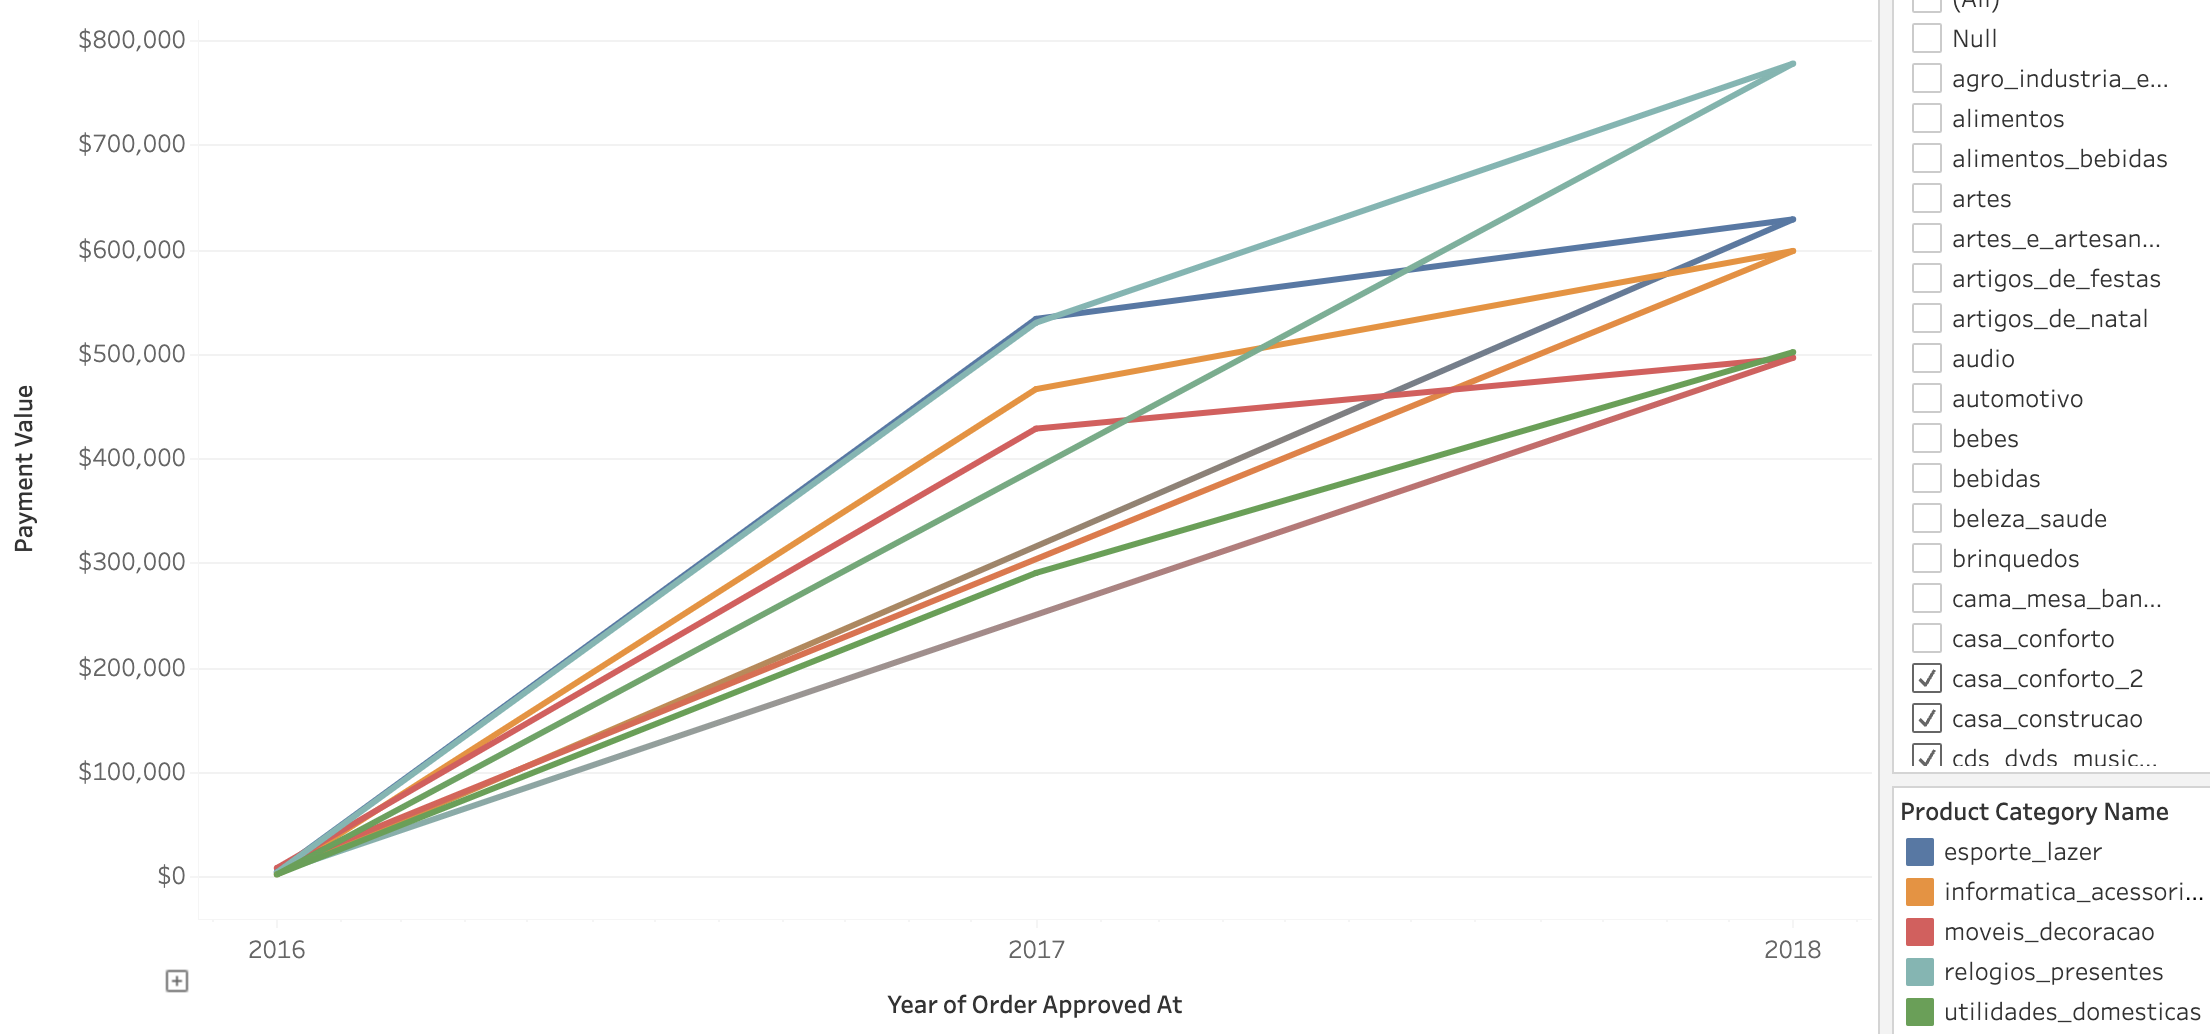
Visualizations of Revenue from 2016-2018

Revenue Growth in Top 5 Product Categories
The Top 3 Most Profitable cities
(This is based of of revenue data from 2016-2018)

Determining which Review Score has the Highest Count

Comparing the Top 5 Highest Rated vs Lowest Rated Product Categories

Act
Guiding Questions
What is your final conclusion based on your analysis?
There is an opportunity for A&B Co to increase their customer satisfaction. There is a large amount of one-star reviews pertaining to the Bed Bath Table category. With more analysis, the company can figure out which specific products are receiving bad scores and why.
How could your team and business apply your insights?
The team can determine the lowest-ranking products and conduct another analysis on the reasoning for the bad reception by the customers. From here they can determine whether they could fix the issue for the bad reviews or remove the product from their listings altogether.
What next steps would you or your stakeholders take based on your findings?
I would recommend a more in-depth analysis of the individual products and why some are so unsuccessful. The individual product data could also assist with targeting certain geographic demographics as we would be able to create marketing campaigns for our high-consuming cities.
Is there additional data you could use to expand your findings?
Additional data that would expand the finding would be information regarding product names, monthly columns, and review titles would add to the data’s value.
Key Tasks
Create your portfolio - Completed
Add your case study - Completed
Practice presenting your case study to a friend or family member - Completed
Deliverable
Your top three recommendations based on your analysis
Formulate another more in-depth analysis regarding which individual products are received poorly and why.
An ad campaign at the popular cities for Bed Bath and Table to increase sales or interest within the product category.
A campaign to increase sales of Bed Bath and Table, especially in less consuming cities. The campaign should provide rewards and benefits for the customer buying from that particular product category.
Conclusion
The A&B Co has the potential to improve its customer reputation through further analysis if it corrects the issues with its poorly reviewed items. It must be noted however that the lower number of revenue during 2016 is due to the data only from September to December. With this however, the revenue of A&B is steadily growing each year clearly showing that the company is offering a service that is in demand. I believe that with proper correction of the low-rated products, A&B Co can improve customer satisfaction. I'd want to express my gratitude to the designers of the Google Data Analytics Professional Certificate for providing me with the knowledge and context I needed to finish my first-ever data project. I also truly recommend it to other newcomers in the data analytics space.